A picture & maybe a trend
% of Mumbai covid deaths in 60+ age-cohort has dipped. Not dramatically, though.

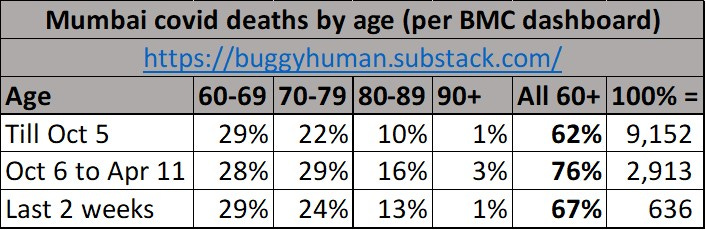
Earlier, my day-wise analysis had shown that those aged 60+ accounted for 76% of Mumbai’s covid deaths between March 23rd and April 10th. Instead of updating day-wise table for last two weeks, I decided to look at longer history. Picture seems to show a dip in this percentage from 76% (over past many months) to 67% in last 2-weeks (hopefully due to vaccination). However, this percentage used to be even lower in 2020 and I don’t know why it went up before it went down. While I’ve shown 62% till October, a media report in December also had this # at 64%. Maybe there’s a trend in here, but not a compelling one. Naturally, too early to assign definitive causality.
(Mumbai’s detailed MIS is at https://stopcoronavirus.mcgm.gov.in/key-updates-trends
However, same link gets updated with latest MIS & I couldn’t find archives. I relied on media reports for older data)
"Time is a great storyteller" - Irish proverb. May be after 2-3 years, we will know the real story .