
Picture, few words: Regional disparities in covid severity
Picture, few words: Regional disparities in covid severity
DL, CT, MH are worst-3; RoI falls into two groups; Sharp deterioration all around

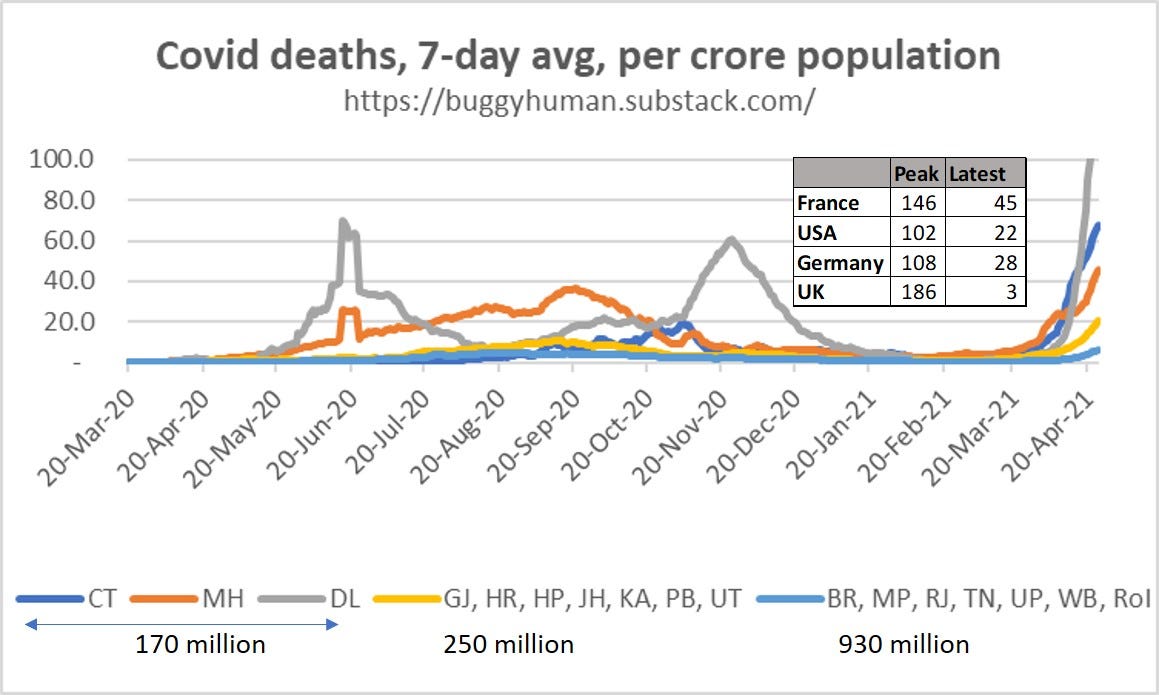
Same metric: deaths per crore people as indicator of covid severity.
Same method: calculated metric for 22 most populous states.
Reference: India was at 8.5 at 2020 peak, is at 16 now (Western country data in table).
Messages:
Delhi is off the charts, literally, at 146. 2x of its prior peak (also, way worse than RoI).
Maharashtra (46), Chattisgarh (68) continue to fare poorly.
Punjab moved from worst-3 to next group.
Within RoI, 7-states, accounting for 18% of population, fare worse than India average.
Next-7 are at 21 (range: 16 to 31), compared to 11 at 2020 peak.
12-states, accounting for 68% of population, fare better than India average.
Best-12 are at 6.2 (range: 2 to 9), compared to 4.4 at 2020 peak.
Surprisingly, 7 of 12 are faring better than at 2020 peak. These include Andhra, Assam, J&K, Kerala, Orissa, TN and West Bengal.
Even more surprisingly, 4 of these 7 are election states. Go figure.
Outside of worst-3 states, India faring better than USA, Germany, France.
Interesting analysis!
Incrementally, more data from worst hit states (also where local media audience is more digital and news origination funnel for international media is much broader) has been more than proportionately picked up which is anchoring the narrative of the situation in "India", again a generalization across states with a loss of specific numerical context. This is like the 'whatsapp-forward" phenomena where the adverse stories are more likely to be picked up and circulated, similarly with international media's reporting where same data points do multiple rounds.
However, I would put more reliance on effective R and CFR (case fatality rates) for comparison for both across countries and internally between the two waves, so that the Numerator and Denominator bias/ noise cancel out. When we use the entire population as the Denominator, the low reliance comes from two aspects as Numerator and Denominator may lose connect (not conclusive in itself, but points to the "hole in the head" argument where we may have to live with imperfect data without making reliable conclusions) -
(i) govt/ mgmt (both state and central) with control on concentrated resources for measuring and disbursing info vs fragmented electorate; again an instance of non-aligned interests and
(ii) primary data points collected at different burial grounds (another source of triangulation) reveal that actual nos are aggregate 3-5x higher over a 2-3 week interval, where the key reason is classification under 'sickness' vs 'covid'; again not conclusive but will alert my antenna to be wary of a systemic deviation/unknowable factors or very high confidence of interval, given control over concentrated resources.
"Even more surprisingly, 4 of these 7 are election states. Go figure." Maybe number of doses administered for number of active cases may give clue. Election states may turn out to be on top compared to states which have much higher cases basis population like Maharashtra, Delhi, etc. Elections diplomacy maybe...