
Exaggerated excess
Exaggerated excess
Even seemingly reasonable analyses can exaggerate excess deaths by over 100%

A slew of recent papers tried estimating excess deaths during covid period. While their approaches differ, they share a common trait. Significant upward bias. Authors and methods consistently err on the side of exaggeration. I demonstrate this by example, dissecting one of the better approaches, for India’s first covid wave. It is premature to debate second wave estimates, while both wave and data are incomplete.
One paper uses a questionable method of copy-pasting IFR (infection fatality rate) from other countries to India, without basis. Even while using death statistics from CRS (civil registration system), its estimate is a panoramic sweep from 0.1 to 2.3 million excess deaths during first wave (equivalent to my claiming Zomato buy-price of 10 to 230). Another paper uses a patient overflow model with oversimplified healthcare capacity assumptions, to unreliably extrapolate from three districts to all of India. I ignore both these papers to focus on a third paper.
What does this paper claim about first wave?
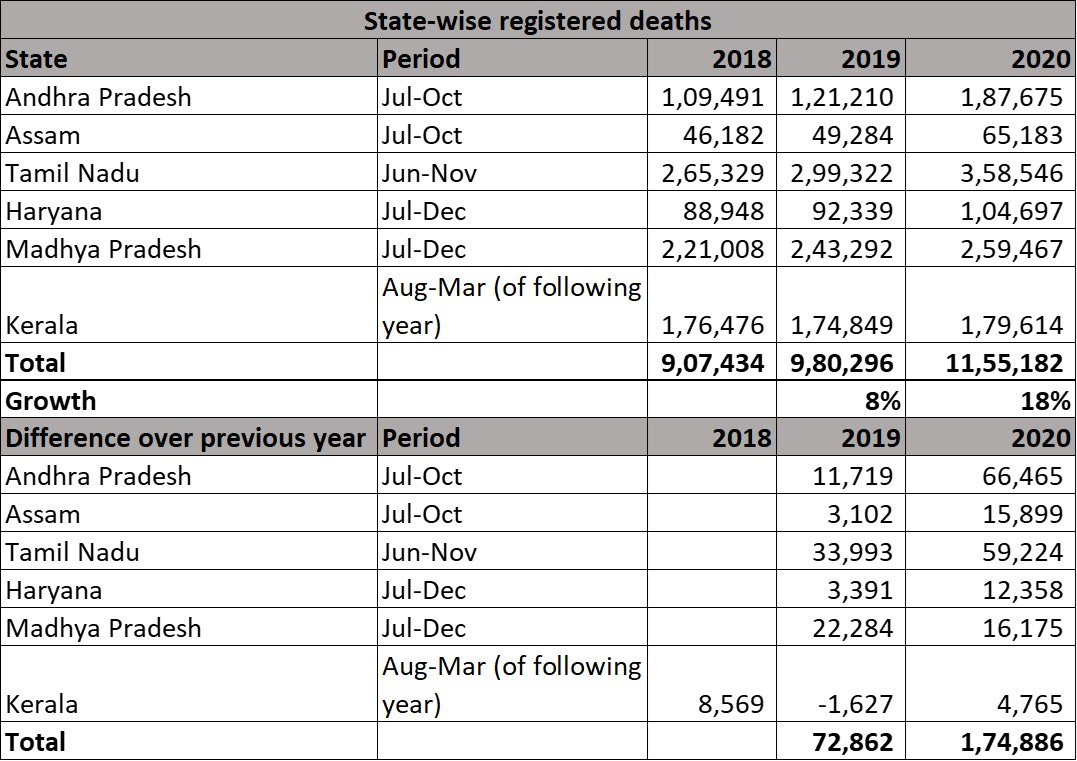
Using CRS registered data for six states for chosen months within 2020 (‘peak period of first wave’), paper estimates 218,000 excess deaths vs baseline (22% increase) for these states. Following table is as shown in this paper.

Few methodological aspects are noteworthy. Only six states are included despite data being available for at least double the number of states. Periods are highly customized, with four different durations employed across six states (Jul-Oct, Jun-Nov, Jul-Dec, Aug-Mar). Baseline is mostly average of 2018/2019 without trend adjustment. Note that trend for these six states is a non-trivial 4.5% increase per year in registered deaths across 2013-19. Lastly, above table shows a direct ratio of excess deaths to reported covid deaths, although studies in West show that only 70-75% of excess deaths are directly due to covid.
What if I applied same method to 2019?
Simplest way to spot pitfalls is to apply identical approach to a previous non-covid year. I take same approach and data, for same states and time periods, and apply them to 2019 (see following table). When 2019 is compared to 2018 in this manner, exercise yields 73,000 excess deaths or 8% increase over 2018. Significant excess deaths well before covid demonstrate that a decent part of above 218,000 figure is an artefact of method, not covid. In fact, comparing 2020 to 2019 (which makes more sense than 2018-19 average) reduces excess deaths from 218,000 to 175,000. If deaths grew by 73,000 in a non-covid year and by 175,000 in a covid year, only the difference of 102,000 can (potentially) be attributed to covid.
To reveal how fickle this method is, let’s look at Kerala. Here, applying same method to 2018 over 2017 yields 8600 excess deaths, way higher than paper’s estimate of 4,500 for 2020. Much as Kerala seems to have a prolonged covid wave, it surely didn’t start in 2018. Kerala’s 4,500 ‘excess’ death estimate is noise, not signal. Incorporating this reduces true excess deaths during ‘peak period of first wave’ to less than 100,000, way below stated 218,000. More generally, with noisy data and imperfect method, it is better to ignore small deviations as inevitable fluctuations around trend, rather than assign meaning to every blip.
Above analysis has reduced first wave excess deaths in these six states from 22% of 2019 deaths to around 10%. Paper’s estimate is inflated by over 100%.
Problem of inadequate trend incorporation
What I demonstrated above is an illustration of improper baseline and inadequate trend adjustment. Distortions can be severe for India, where all-India trend growth rate is 3% a year. 2018 and 2019 saw registered deaths grow 8-10% a year, well before covid. Above six states saw deaths grow 8% during chosen period of 2019. Against this uptrend, calculating excess deaths as simplistic difference between one period and another is erroneous. To illustrate this point, imagine applying this paper’s method across all of India for prior years. 2019 excess deaths are calculated by deducting average of 2017-18 and so on. Resulting ‘excess’ deaths are shown in following table.

Nearly a million excess deaths per year can be conjured, without any covid.
Cherry-picking problem
Choice of customized time-periods for each state is also a problem. Choice is made by eyeballing monthly deaths and choosing contiguous months with high deaths. To select high-death months and conclude that deaths are high is circular reasoning. If implicit premise is that official data is unreliable, we can’t be sure of exact start and end dates for ‘peak covid’, nor can we choose it subjectively. If covid first-wave started in early-2020 and tapered off in early-2021, objectivity requires including data pertaining to entire period, to see how deaths trended.
Researchers find this inconvenient as they have to include lockdown period, which clearly witnessed covid, but had depressed registered deaths. Excluding lockdown period equates to an extreme assumption that zero lockdown-period deaths were registered with a lag after lockdown ended. Both belated registration and covid can lead to excess deaths in post-lockdown period. With majority of Indians now having access to formal finance, it feels odd for them to forego something essential for transferring assets to next of kin. The opposite, 100% registered with a lag, may not hold either. But, without estimating both extremes, we only have an upper-bound, not range.
If I uniformly consider all of 2020 for these six states, registered deaths grew 7.4% over 2019. Excess deaths correspond to 2.9% of 2019 registered deaths (i.e. 7.4% minus 4.5% trend). With over 2 million registered deaths in 2019, 2020 witnessed 60,000 excess deaths across six states. Lower bound is 60,000 over 2020. Upper bound is 100,000 over chosen period (roughly half of 2020). This range of estimates is 30-45% of what is estimated in the paper. Even from this lower range, we cannot directly extrapolate to pan-India. A larger sample of 14 states witnessed lower deviation from trend than these six states, implying that rest of India did better on a per capita basis.
Using only one side of the distribution
Cherry-picking can take other forms too. Paper includes following para (pertaining to a slightly different analysis of CRS data):
“Kerala, Gujarat, Bengaluru, and Hyderabad had slightly fewer expected than reported deaths compared to the baseline years of 2015-19. We assigned these as zero excess deaths, as it is improbable that total mortality fell during peak COVID weeks.”
Any parsing of data will produce a range of outcomes. Some favourable to hypothesis, some unfavourable. Some on one side of distribution, some on other. Retaining convenient data-points while cancelling inconvenient ones isn’t sound statistics. Cherry-picking one side of the distribution is a sure path to a biased estimate. Presupposing some outcomes as implausible (or selectively blaming data quality) while wholeheartedly accepting others is inconsistent. If I made the case to invest in a company only based on good years, I’d face serious career risk.
How about other approaches employed in this paper?
I focused on the most reliable CRS-based approach, of the three employed in this paper. Other two data sources – National Health Mission, consumer survey – are both admittedly less reliable. Even within CRS method, I ignore a similar estimation using city-level data since cities witnessed way higher increase in deaths than even their home states (e.g. Mumbai, Chennai, Kolkata, Bangalore in 2020), making them unsuitable for extrapolation. I also ignore ratios calculated using UN-estimated deaths for 2019, following the golden rule of basing estimates only on data, not others’ estimates.
What does this mean for pan-India excess deaths in 2020?
Across its three methods, report estimates roughly 0.6 million excess deaths during India’s first covid wave. In light of above analysis, true figure could be less than half of that. Further, only a subset of excess deaths are attributable to covid. Given 0.16 million reported covid deaths, undercount factor for first-wave is not far from ‘innate’ undercount factor seen across countries (>1.5x even in Western countries with better systems).
I have not addressed India’s second covid wave as it is premature for precise estimates. That does not imply complete ignorance. Available evidence provides a clear directional sense. Spike seen in registered deaths across states during April-May-June 2021 is severe and unprecedented. This is well above what can be accounted for by data unreliability or trend adjustment. While touted estimates have the same methodological problems and exaggeration bias, excess deaths and covid undercount seem higher in second wave.
Deriving true covid deaths is crucial, both to understand what happened and to prepare for what is to come. However, failing to do this reliably and objectively is counterproductive. A consistent upward bias harms understanding and credibility.